The most expensive failures in any automation platform are the ones you never see. A proxy pool that quietly drains to zero, a submission queue that stalls overnight, an enrichment run that burns API credits on records it can never complete — none of these throw an obvious error. They just quietly stop delivering the results you are paying for. System health monitoring is the layer that makes those silent failures loud: LinkSpear watches every moving part of your lead-generation and link-building workflow and surfaces the moment something degrades, stalls or starts wasting money, in a single feed you actually check.
LinkSpear runs a lot of machinery on your behalf — discovery pipelines, a live proxy pool, background queues, a Chrome extension pushing real submissions, and enrichment jobs visiting thousands of sites. When that many systems run unattended, the question is never whether something will hiccup, but whether you find out in time to fix it. This page explains exactly what LinkSpear's system health monitoring covers, how it works step by step, the concrete outcomes it delivers, who benefits most, and how it ties into the wider workflow alongside lead enrichment and the directory backlink builder.
What system health monitoring actually is
System health monitoring is the continuous, automated observation of every operational subsystem in your account — the jobs, queues, proxies, submissions and spend that keep results flowing — with clear alerting the instant any of them falls out of a healthy range. It is not a static status page that only turns red when the whole platform is down. It is a granular, per-subsystem watch that catches the difference between "working" and "working the way it should."
The distinction matters because most operational damage happens in the grey zone. Your account is not offline; it is simply underperforming invisibly. A queue is running but backed up by ten thousand jobs. Proxies are present but most are dead. Enrichment is executing but silently skipping every record because a credential expired. Health monitoring exists to expose these half-broken states before they compound into a bad month.
The subsystems LinkSpear watches
- Background queues: depth, throughput and age of the oldest job across the general, discovery and link-scanner channels, so a stalled or ballooning queue is caught early.
- The proxy pool: the count of live, working anonymous proxies and the trend over time, so you know before the pool that powers rotating proxies runs thin.
- Failed and retrying jobs: anything that errored, timed out or exhausted its retries — surfaced with the reason, not buried in a log file.
- Submission and extension activity: whether directory submissions are completing, being blocked, or hitting captchas at an unusual rate.
- Spend and API usage: discovery and enrichment credit consumption, with alerts when spend accelerates or a run burns budget without producing usable data.
- Long-running processes: the health of detached workers like the proxy farm, so a crashed background process is noticed rather than assumed to be running.
How LinkSpear monitors your account, step by step
The whole point is to run invisibly until it needs you. LinkSpear is quiet when everything is healthy and precise when something is not. Here is the full cycle.
Step 1: Establish what healthy looks like
Monitoring needs a baseline. LinkSpear tracks the normal operating range for each subsystem — typical queue depth, the usual number of live proxies, expected job success rates, and normal daily spend. Alerts fire on deviation from that baseline, so a busy day of legitimate activity does not look like a problem, and a genuine collapse does not hide inside "normal" totals.
Step 2: Sample every subsystem continuously
On a rolling schedule, LinkSpear samples each moving part: it counts pending and failed jobs per queue channel, checks how many proxies are live, measures how long the oldest unprocessed job has been waiting, tallies submission outcomes, and adds up credit spend for the current window. These are cheap, frequent checks designed to catch a downward trend early rather than after the damage is done.
Step 3: Classify each signal against thresholds
Each sample is compared against a healthy threshold and classified — healthy, degraded or critical. A queue with a handful of jobs is healthy; one whose oldest job has sat untouched for an hour is degraded; one growing without bound is critical. A proxy pool at full strength is healthy; one that has lost most of its members is critical. This turns raw numbers into a decision you can act on at a glance.
Step 4: Detect change, not just state
Health monitoring is a trend, not a single snapshot. LinkSpear compares the current reading with recent history to tell a steady state apart from a sudden shift. A proxy count declining for hours is flagged before it hits zero. A failure rate that spikes from near-zero to double digits is caught on the transition, when you can still intervene, rather than after the run is ruined.
Step 5: Surface issues where you already work
When a subsystem degrades, LinkSpear raises it as an operational alert in your in-app Audit Log — the same place your other operational and cost events already land. Each alert carries the subsystem, the healthy range, the current reading, the likely cause and a timestamp. You get a running feed of exactly what changed and when, so triage is a glance rather than a forensic dig through server logs you may not even have access to.
Step 6: Guide remediation, never act destructively
Every alert pairs the problem with a sensible next step: restart a stalled worker, top up the proxy pool, pause a run that is leaking spend, or investigate a credential that has expired. Crucially, monitoring is report-only where your data is concerned. It observes and alerts; it never deletes records, deactivates your links or directories, or silently kills work on your behalf. You stay in control of every corrective action, so a false alarm can never quietly destroy something valuable.
Because each step is automated, the day-to-day experience is calm. You get on with running campaigns and winning clients, and LinkSpear only interrupts you when something genuinely needs a decision. That inversion — silence when all is well, a precise alert when it is not — is what makes continuous monitoring sustainable instead of a chore that slides down the to-do list.
Why systems fail silently in the first place
Understanding the failure modes makes the value obvious. In an automation platform, the dangerous failures are rarely dramatic crashes; they are quiet degradations that keep the lights on while the results stop.
- Resource exhaustion: a free-proxy pool erodes as public proxies die, and if nothing replenishes it, the browsing and enrichment that depend on it slow to a crawl without any error being thrown.
- Queue backpressure: a burst of work lets jobs pile up faster than workers can clear them, so results arrive later and later until the backlog looks like an outage.
- Expired or throttled credentials: an API key hits a rate limit or lapses, and every dependent job fails identically — often while still consuming a retry budget or partial spend.
- Crashed background workers: a long-running detached process dies, and because nothing was watching it, the system assumes it is still running and quietly stops producing output.
- Rising block rates: a target directory tightens its defenses and starts serving captchas, so submissions fail at a growing rate that no single failure makes obvious.
- Spend leaks: a misconfigured or looping run keeps calling a paid API on records it can never complete, draining credits with nothing to show for it.
None of these events emails you a warning. The only reliable way to catch them is to watch the operational signals continuously — exactly what health monitoring does on every cycle.
What system health monitoring detects
A platform can be unhealthy in many distinct ways, and each calls for a different response. Effective system health monitoring distinguishes between them rather than lumping everything into one vague "error" state.
| Detected state | What it means | Recommended action |
|---|---|---|
| All healthy | Every subsystem inside its normal range | Nothing — this is the goal |
| Queue backing up | Oldest job aging, depth climbing | Scale or restart workers; check the blocker |
| Proxy pool thin | Live proxy count trending toward zero | Trigger a proxy farm run to replenish |
| Job failure spike | Error rate above the normal baseline | Inspect the reason; fix the shared cause |
| Spend accelerating | Credit burn outpacing usable output | Pause the run; review configuration |
| Block / captcha surge | Submissions rejected at an unusual rate | Check the target; adjust cadence or route |
| Worker down | A detached process is no longer running | Relaunch it; confirm it holds its lock |
By separating a temporary blip from a genuine collapse, LinkSpear prevents both false alarms and missed failures — the two problems that make occasional manual checking so unreliable.
Why it matters: the concrete benefits
Monitoring is not overhead. It protects the return on every campaign you run and every credit you spend, and it protects the trust your clients place in you. The payoffs are direct and measurable.
- Catch failures in minutes, not days: a stalled queue or dead proxy pool is flagged the moment it degrades, not next week when a client asks why nothing shipped.
- Stop spend leaks before they hurt: alerts on accelerating credit burn mean a runaway run is paused while it has cost you pennies, not your whole month's budget.
- Protect delivery and rankings: when submissions and enrichment keep flowing, your citation building stays on schedule and your ranking work does not silently stall.
- Report with confidence: agencies can show clients that the machinery ran cleanly, with a timestamped record of health, instead of hoping nothing broke behind the scenes.
- Prioritise the right fire: a critical proxy collapse matters more than a single retrying job; classification tells you what to fix first so you never waste effort on noise.
- Reduce the operational tax: you stop babysitting dashboards and logs, freeing the hours you would otherwise spend checking whether things still work.
Continuous monitoring vs. the usual alternatives
Most teams handle operational health one of three ways: ignore it until something visibly breaks, check manually now and then, or bolt on a generic uptime tool that only knows whether the site responds. Here is how continuous, subsystem-aware system health monitoring compares.
| Approach | Freshness | Catches silent degradation? | Effort | Alerts on change? |
|---|---|---|---|---|
| No monitoring | None | No | Zero — until results vanish | No |
| Manual spot checks | Whenever you remember | Rarely | High, tedious | No |
| Generic uptime pinger | Live but shallow | No — only "is it up" | Low | Only on hard downtime |
| LinkSpear health monitoring | Live, per subsystem | Yes | Automated | Yes, on degradation |
The difference is depth and timing. A generic pinger tells you the front door is open; it says nothing about whether the queues are moving, the proxies are alive or the spend is under control. Subsystem-aware monitoring compresses the gap between "something degraded" and "you know about it" to a single check cycle, turning operations from firefighting into routine upkeep.
Who system health monitoring is for
A few groups feel the value immediately.
Marketing agencies running many accounts
An agency cannot manually verify that every client's pipelines are healthy every day. Monitoring scales across every agency sub-account, so each client's queues, proxies and spend are watched independently, and a problem in one account is surfaced without dragging your attention from the rest. That reliability is a genuine retention lever — clients notice when delivery never mysteriously stalls.
High-volume link builders and lead teams
Teams pushing thousands of submissions and enriching large lead lists live and die by throughput. When the proxy pool that powers rotating proxies thins out or a queue backs up, output quietly collapses. Health monitoring keeps that volume honest by catching the slowdown long before it becomes a lost week.
Local service businesses running lean
Trades like plumbers and electricians using LinkSpear without a dedicated ops person cannot afford to babysit infrastructure. For them, monitoring is the safety net that keeps the automation producing leads and citations even though nobody is watching a server — and if something needs a decision, it shows up in plain language in the app.
Anyone spending on discovery or enrichment credits
If money flows into paid discovery or enrichment, spend monitoring confirms every credit is producing usable data. It is common for a misconfigured run to quietly drain budget on records it can never complete; without monitoring, you would only find out at the invoice.
Reading and acting on the results
Detection is only useful if it leads to a fast fix. LinkSpear presents health as a prioritised worklist rather than a wall of metrics, so the highest-impact problems rise to the top and trivial ones stay out of your way.
Triage by impact, not by volume
A critical proxy collapse or a spend leak is treated as far more urgent than a single job retrying once. The Audit Log orders operational alerts so you spend your remediation time where it moves the needle. You can see at a glance which signals threaten delivery and which are cosmetic.
A clear remediation path for each state
Every alert pairs the detected change with a sensible next action: relaunch a downed worker, trigger a proxy farm run to replenish the pool, pause a run that is leaking credits, or check a target that has started blocking submissions. The point is that you always move from "something changed" to "here is what to do" without leaving the platform or digging through raw logs. Because every health event is timestamped and logged, you also build a historical record of your account's operational lifecycle — when a subsystem degraded, when it recovered, and how often a problem recurs — invaluable when a client questions a slow week.
How it fits the wider LinkSpear workflow
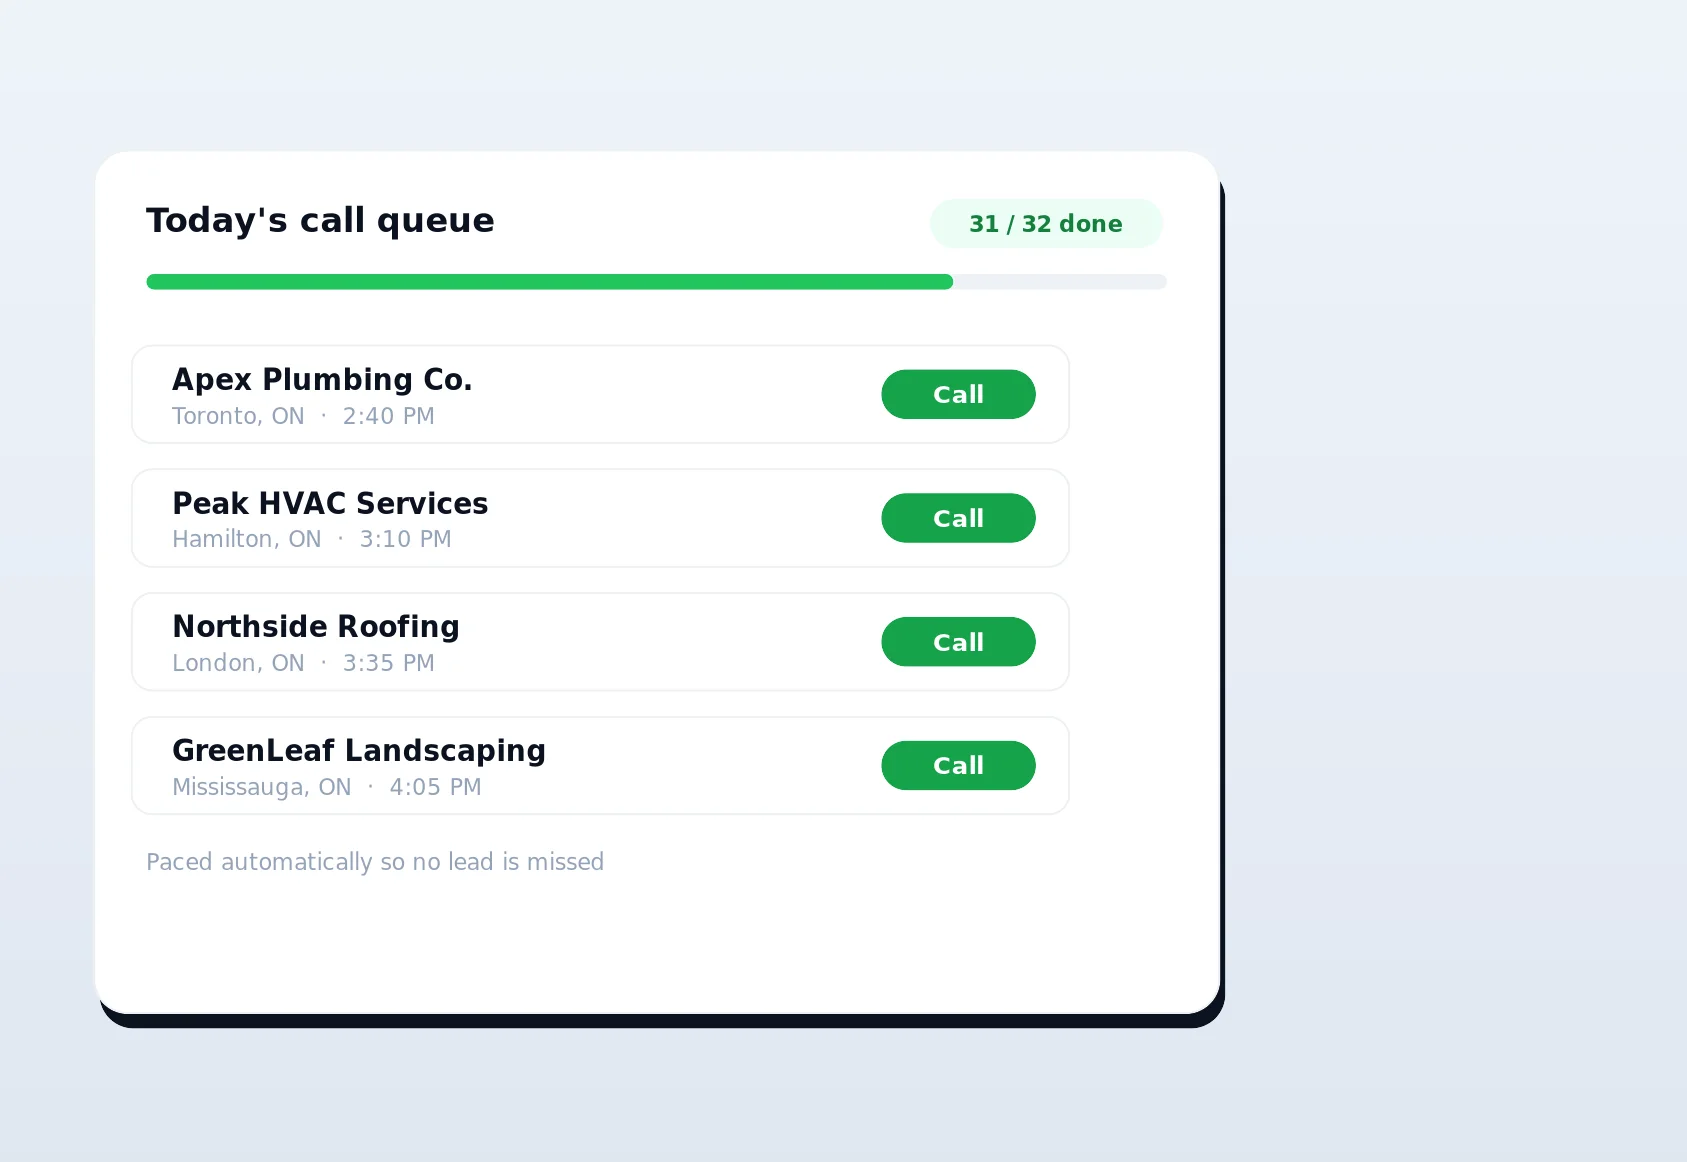
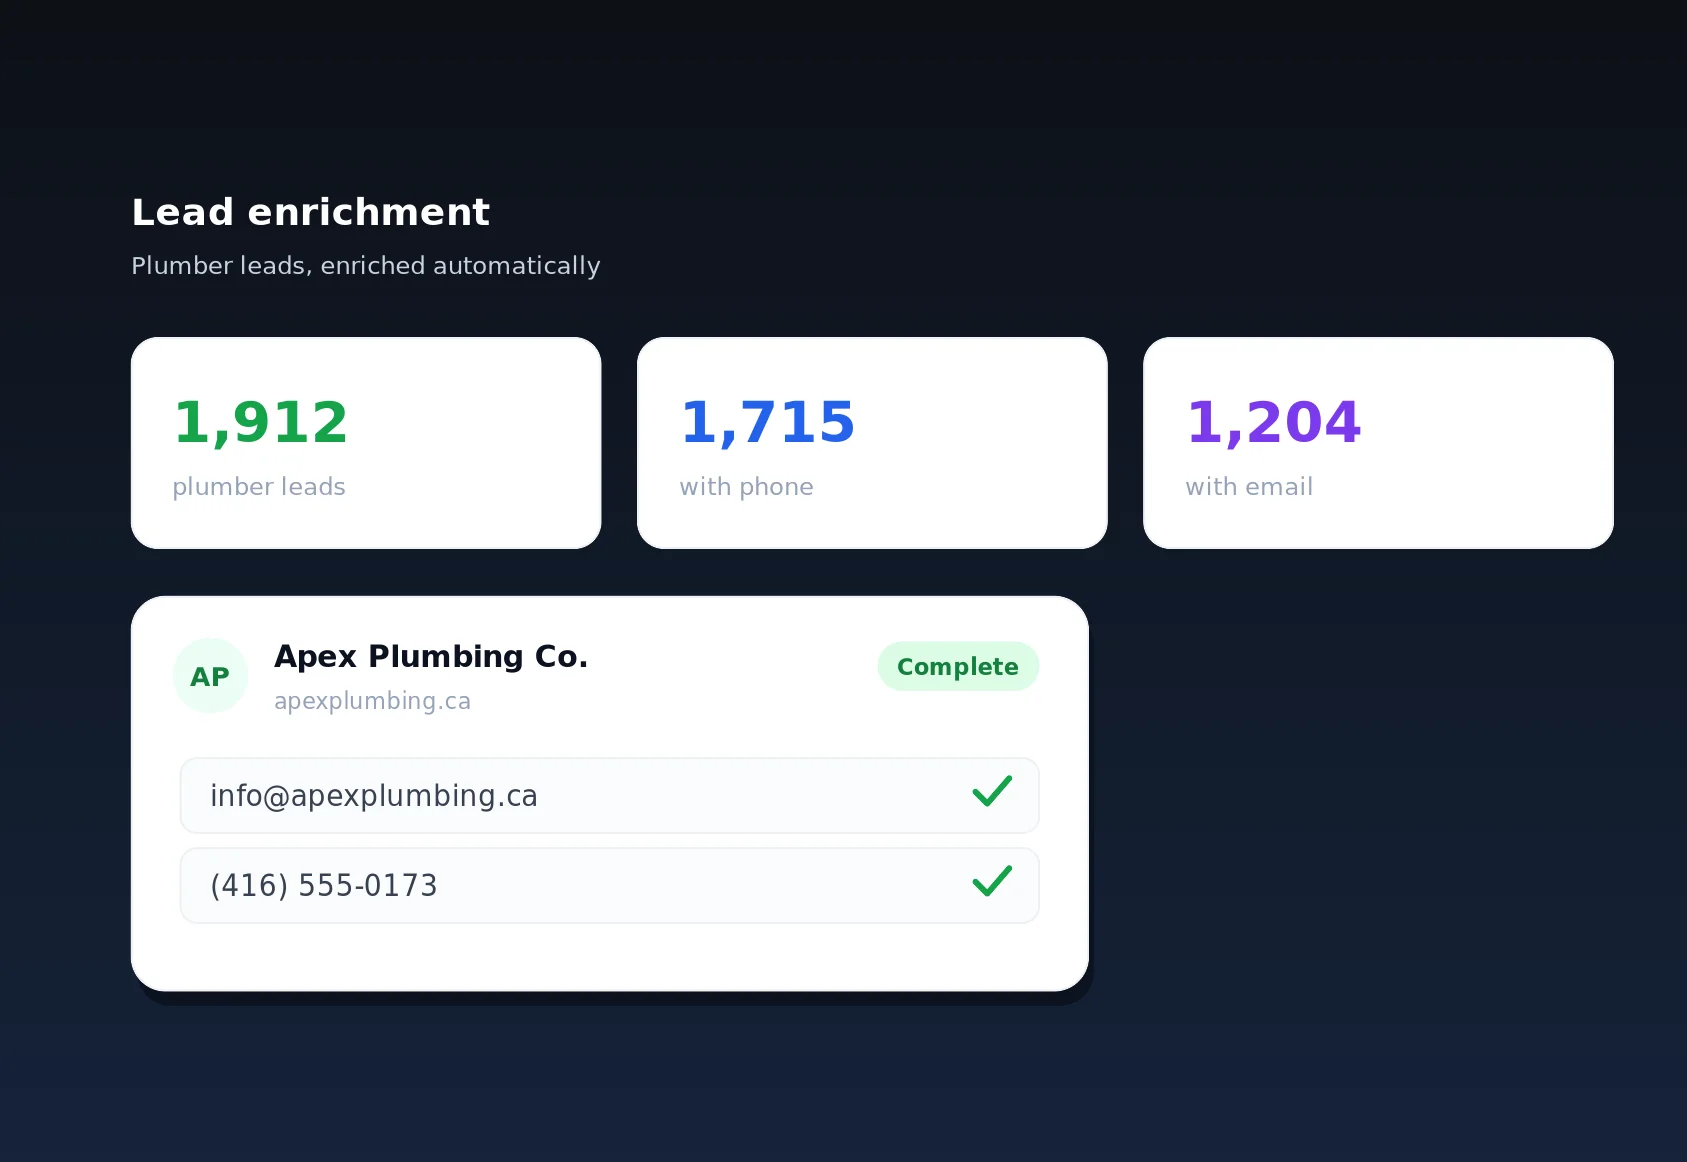
Health monitoring is the connective tissue that keeps LinkSpear's build-and-grow cycle running rather than a standalone gadget. The flow is straightforward: you discover prospects and build the local business directory, enrich records with lead enrichment through anonymous proxies, hand businesses to reps via call queuing, and build citations and backlinks through the directory backlink builder and Chrome extension.
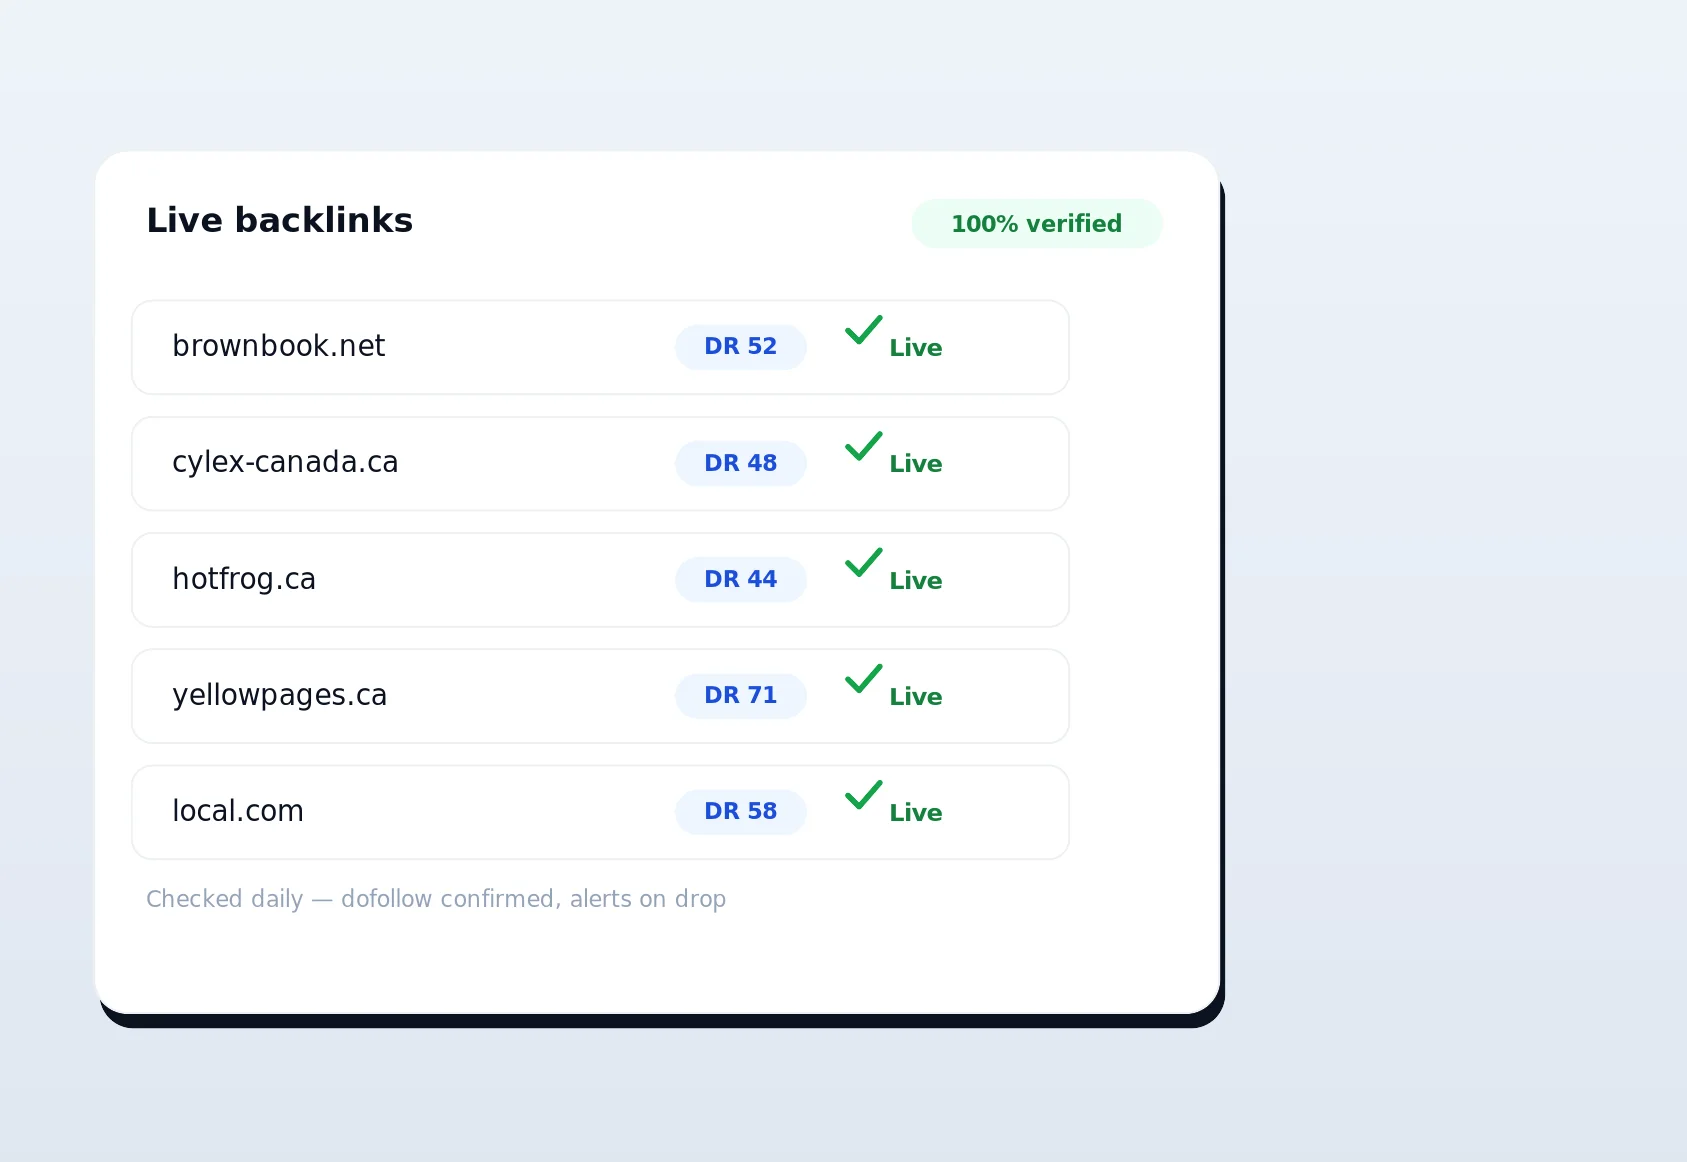
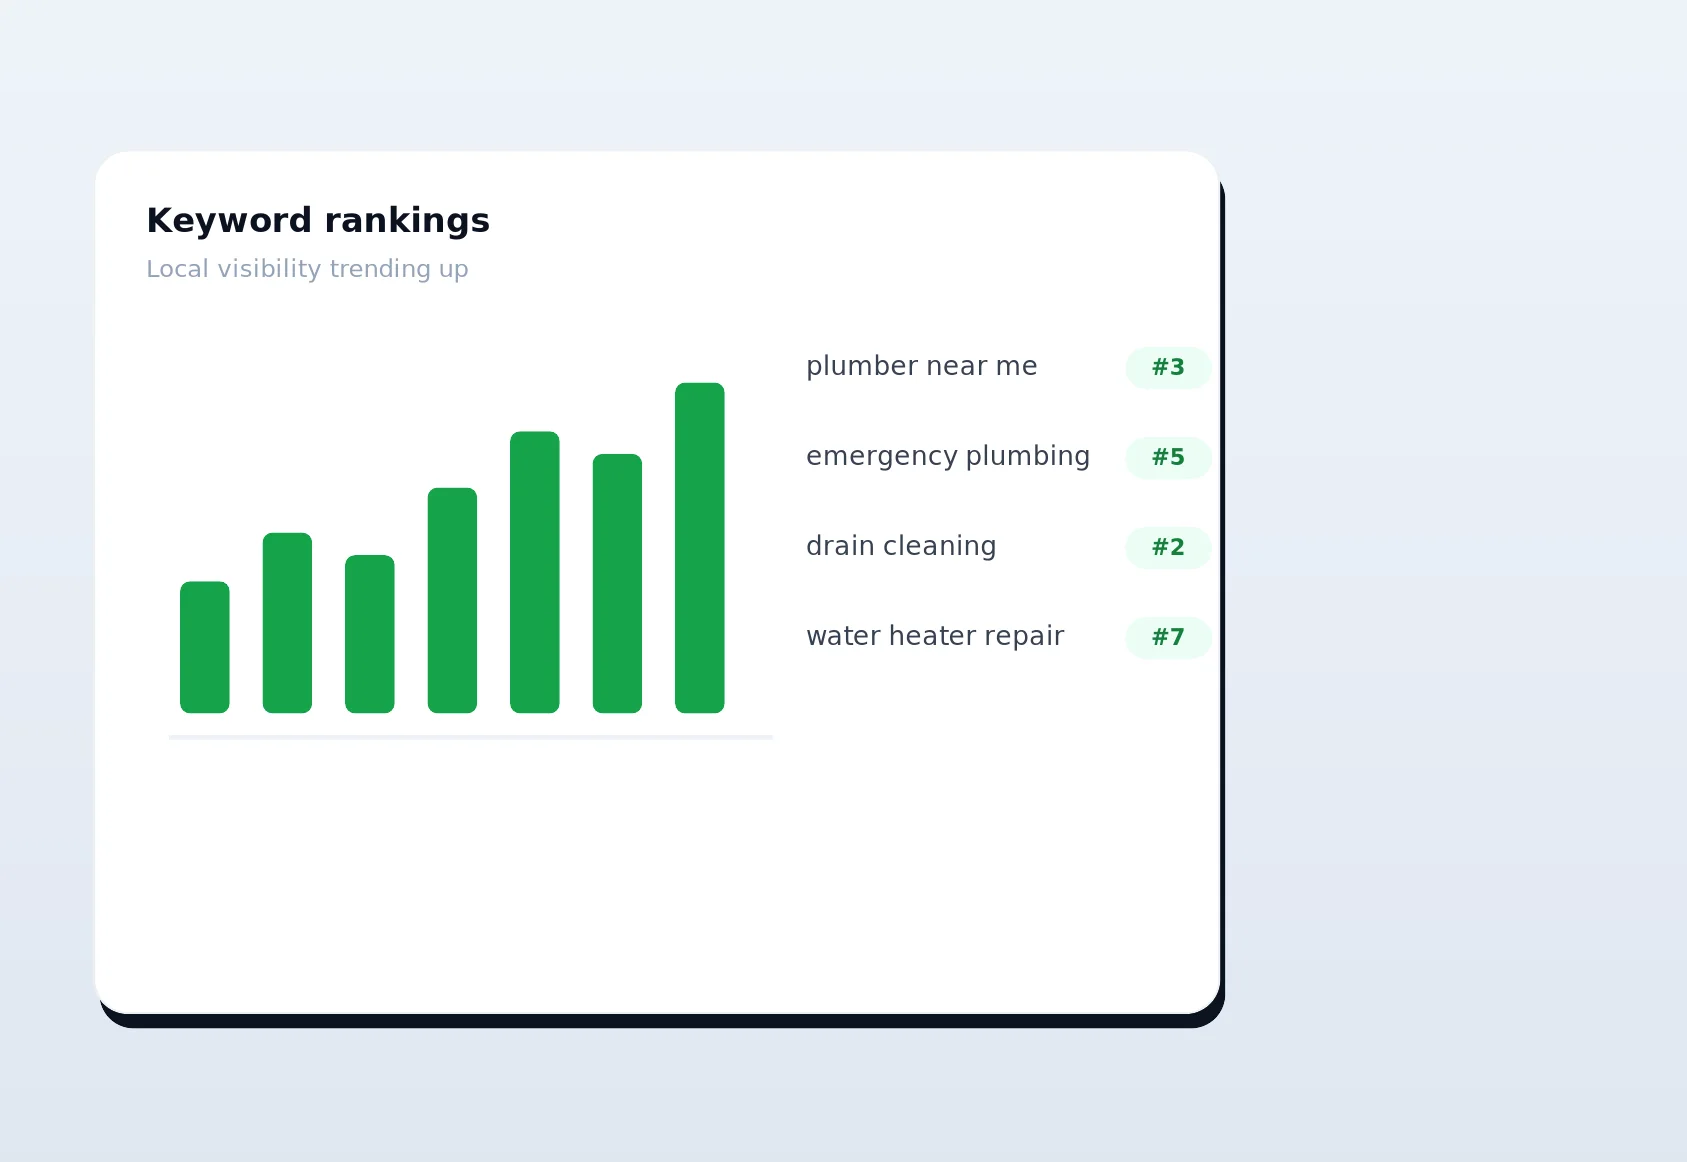
Every one of those stages depends on healthy infrastructure underneath. Monitoring watches that infrastructure so the rest of the program keeps its footing: enrichment does not silently stall for lack of proxies, submissions do not pile up in a stuck queue, and rank tracking and live link verification keep receiving fresh data on schedule. When the plumbing is watched, every stage downstream can be trusted to run.
Built for safe, resilient watching
Monitoring that cries wolf is worse than none at all, and monitoring that acts destructively is dangerous. LinkSpear's design avoids both. Alerts fire on genuine deviation from an established baseline, not on every busy moment, and a subsystem is never marked critical on a single transient reading — a momentary spike has to persist or worsen before it escalates. Most importantly, health monitoring is strictly report-only with respect to your data: it observes, classifies and alerts, and it never deletes a record, deactivates a link or directory, or kills a run on its own. You always decide what to do with the information, which means a false signal can never silently erase something real and valuable.
Start monitoring your account today
Every automation you run is either quietly delivering results or quietly failing — and without system health monitoring you have no way to know which until the damage is done. LinkSpear turns that uncertainty into a clear, continuously updated picture: healthy and flowing, or flagged for action with a cause and a next step. You stop losing results in the dark, you stop leaking spend on runs that produce nothing, you report to clients with proof the machinery ran clean, and you fix problems in minutes instead of a week too late. New users get a 14-day free trial on the Starter plan — no long-term commitment — so you can connect your account, watch the first health cycle complete, and see exactly which parts of your workflow are humming and which need a hand. Start your free trial and put your entire operation under continuous watch today.